
Much confusion has arisen about when to test, what are the best tests, what do the results mean for SARS-CoV-2. The biggest lie is that they are the reason the numbers have risen so fast lately. If we don’t see it, we can’t report it, nor can we even begin to control it. The highest level of separation of what tests tell us is the distinction between incidence and prevalence of infection. The frequency (number of health events in a population and it’s relationship of that number to the size of the population is prevalence) and pattern (the occurrence of health-related events by time, place, and person is incidence) of health events in a population. COVID is a dynamic moving target for diagnostics and when target levels are measured in the course of the infection is critical. When the USAF Biological Counterproliferation Team at Brooks was still active, we told commanders and general officers that the only way to make an informed decision about a biological attack was to run three orthogonal tests (measuring different aspects of a biological agent by different methods). If only two were run, then they should have a coin to flip to make a decision. The third test was a tie breaker in case one of the other tests were positive and the other negative. The fundamental tests are (1) isolation, culture and identification, (2) PCR (polymerase chain reaction, for SARS-CoV-2, real time reverse transcriptase PCR, RNA to DNA to complete the reactions), (3) antigen testing (measuring parts of virus other than RNA with specific indicator labeled antibody), and finally, (4) measuring antibody levels in serum with a specific viral antigen, and sometimes, measuring type of antibodies with second labeled antibody https://www.nature.com/articles/d41586-020-02661-2. The last one is the least useful for early diagnosis, except if IgA or IgM antibody is measured. As noted in an earlier post, IgA, and/or IgM decline within 3 months. It is the IgG, particularly IgG3, that lasts longer: 7 months and the memory B cells even longer.
Culture is dependent on taking samples from actively shedding sites and blocking contamination, especially bacterial with antibiotics, and isolating specific plaques showing cytopathic effects (CPE) on at least partially selective host cells. However, such CPE may vary from very subtle host cellular changes to out right lysis, leaving holes in a single continuous mono layer of host cells in culture. The difficulties are obvious, and multiplying virus in the lab is hazardous https://www.ncbi.nlm.nih.gov/pmc/articles/PMC7036342/pdf/jkms-35-e84.pdf and https://www.protocols.io/view/culture-of-the-severe-acute-respiratory-syndrome-c-bcduis6w.
PCR is easier and only requires isolation of the RNA in this case, removing inhibitors or performing viral lysis and release of intact RNA in the process. However, it measures genomic equivalents of virus, if quantitative, but for most commercially available tests, only threshold of detection, but not necessarily infectious virus. Fortunately, most viral RNA is resistant to ubiquitous environmental RNA degrading enzymes. The threshold for a positive is the number of PCR replication cycles to produce detectable DNA copies, usually less than 35 to 30 cycles (Ct, cycle threshold) of the PCR machine. Cts < 29 are strong positive reactions indicative of abundant target nucleic acid in the sample. Cts of 30-37 are positive reactions indicative of moderate amounts of target nucleic acid. Cts of 38-40 are weak reactions indicative of minimal amounts of target nucleic acid which could represent an infection state or environmental contamination.
In a PCR study of 396 patients, time until negative conversion was significantly shorter in the asymptomatic group than in the symptomatic group: median 14.5 days (11.0–21.0 days) and 18.0 days (15.0– 22.0 days), respectively. Rebound of thermal cycle threshold of detection values (Ct) was seen in 78 patients (19.7%). Time until negative conversion is shorter in asymptomatic COVID-19 than in symptomatic COVID-19. Rebound of Ct values was common https://www.ijidonline.com/action/showPdf?pii=S1201-9712%2820%2930620-2.
The antigen tests measure the outer proteins of the virus and must be sampled, isolated from binding inhibitors, and detected in a tube or chromatographic surface, by trapping in a precipitate or along a diffusion path and labeling it specifically, usually with a second antibody in addition to the trapping one, with a colorimetric or fluorescent reagent. This test can be quantitative in a micro titer well plate (replacing tubes) by making dilutions to extinction, or below threshold of detection. The bed-side immunodiffusion rapid tests are only positive or negative tests. The course of an infection or the quality of the sample and its quantitative viral content control the outcomes https://www.ijidonline.com/action/showPdf?pii=S1201-9712%2820%2930658-5. One study showed a high sensitivity and specificity in samples mainly obtained during the first week of symptoms and with high viral loads. The rapid antigen assay has the potential to become important for early diagnosis of SARS-CoV-2, especially in situations with limited access to molecular methods. Sensitivity and specificity were 93.9% (86.5–97.4%) and 100% (92.1– 100%), respectively, with a diagnostic accuracy of 96.1%. Sensitivity was significantly higher in samples with high viral loads https://www.ijidonline.com/action/showPdf?pii=S1201-9712%2820%2930405-7.
Seroprevalence is most useful in determining the vulnerability of a population as opposed to the incidence, a rate, showing the most immediate infection progression.
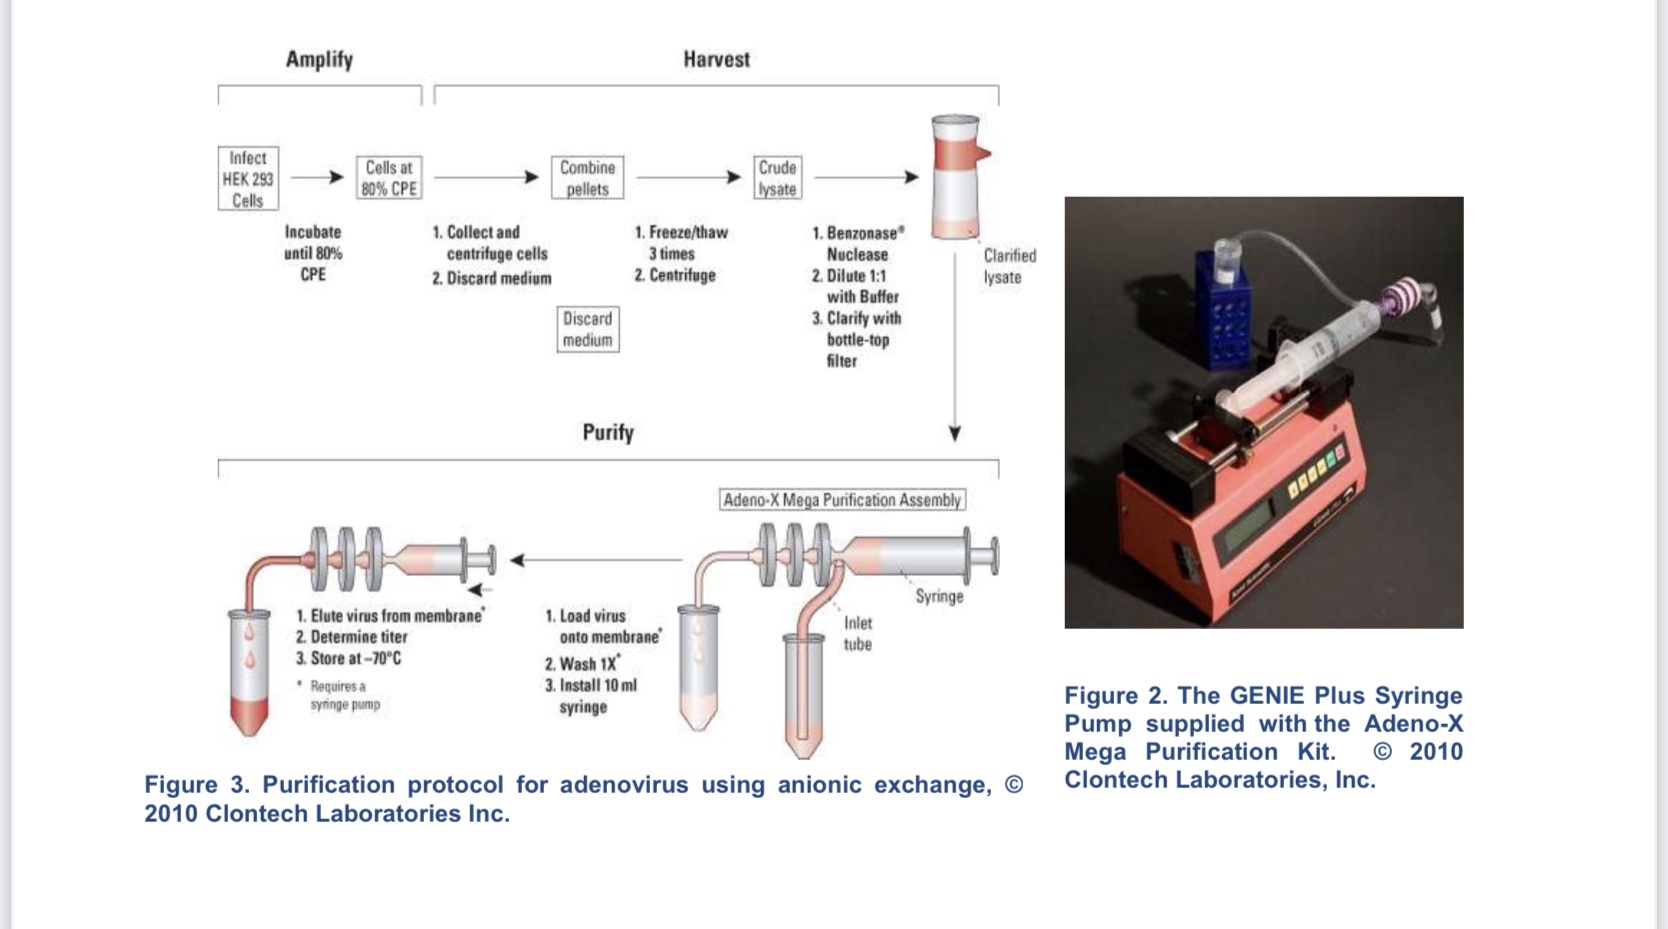
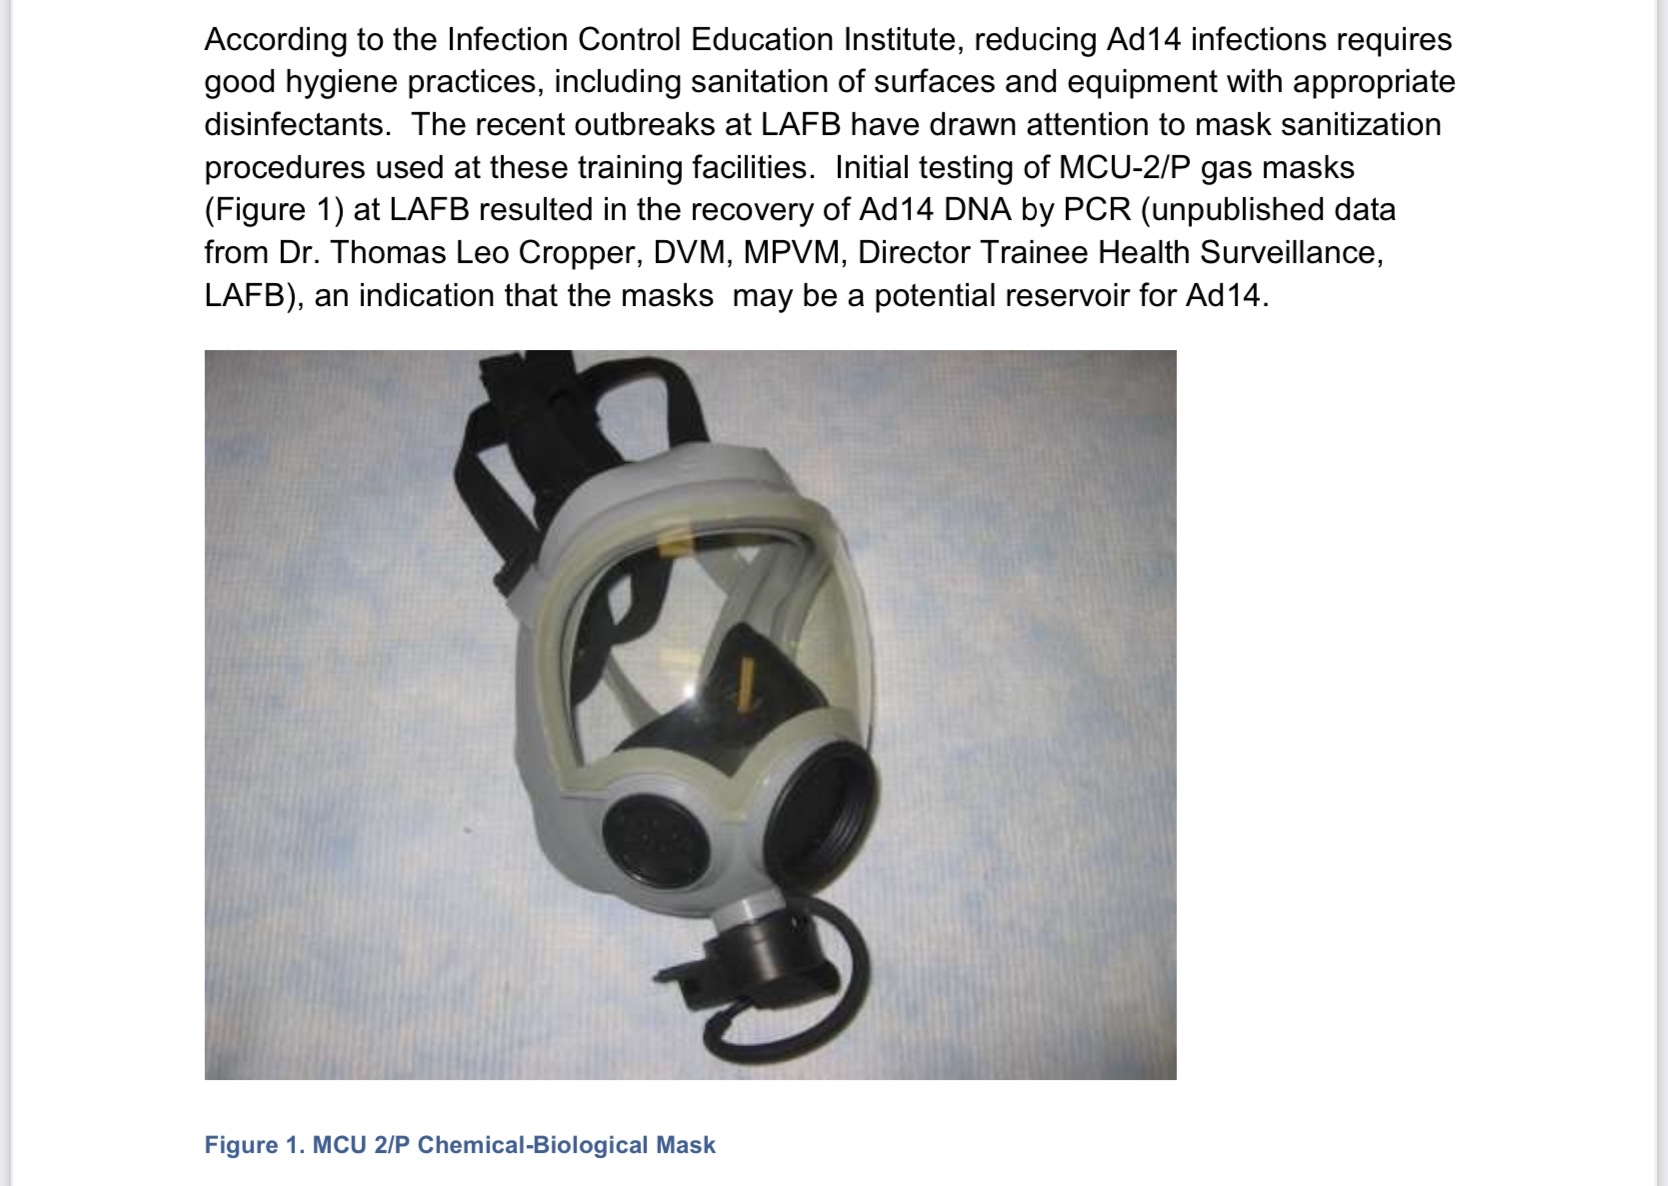
To show how difficult the gold standard for viruses, isolation and culture, and converting these numbers into quantitative PCR is, I give work we performed at Brooks on adenovirus, a human virus causing everything from mild, cold-like symptoms to death and with asymptomatic human carriers, depending on the strain, as an example. It is a much more durable virus than SARS-CoV-2 and can easily be spread by fomites and airborne secretions. We investigated its transmission by shared gas masks used for training and supposedly disinfected, because of some deaths from the virus amongst recruit trainees (Establishment of Optimal Parameters for United States Air Force MCU-2/P Mask Sanitization Procedures to Effectively Neutralize Adenovirus Serotype 14).
From the initial copy numbers generated during the RT-PCR reaction, the titer (ge/mL: genomic equivalents per milliliter) of each unknown sample was calculated as shown below:
Copy Number 1 X 10e3 μL Titer = 9 μL x 10 x Dilution Factor x mL
Titration methods fall into one of two categories: determination of either the infectious or the particle (infectious plus noninfectious) titer. To overcome this problem, the current RT-PCR assay was developed to detect only encapsidated viral genomes. Nonencapsidated and/or incomplete genomes were eliminated during the DNase treatment (to destroy free DNA not extracted from intact virus) step, more accurately reflecting the infectious titer.
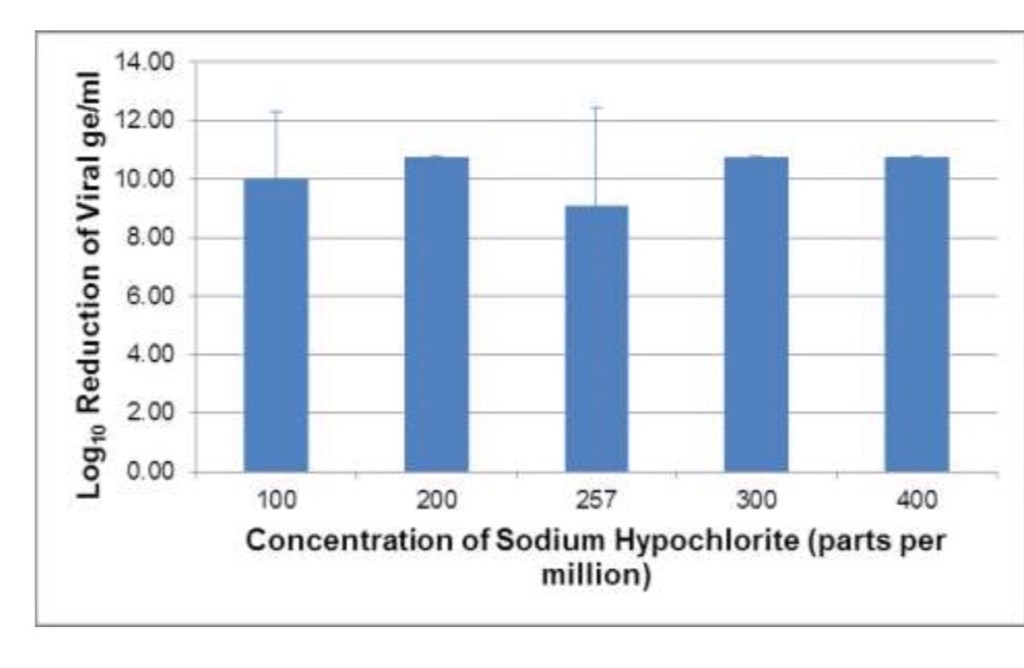
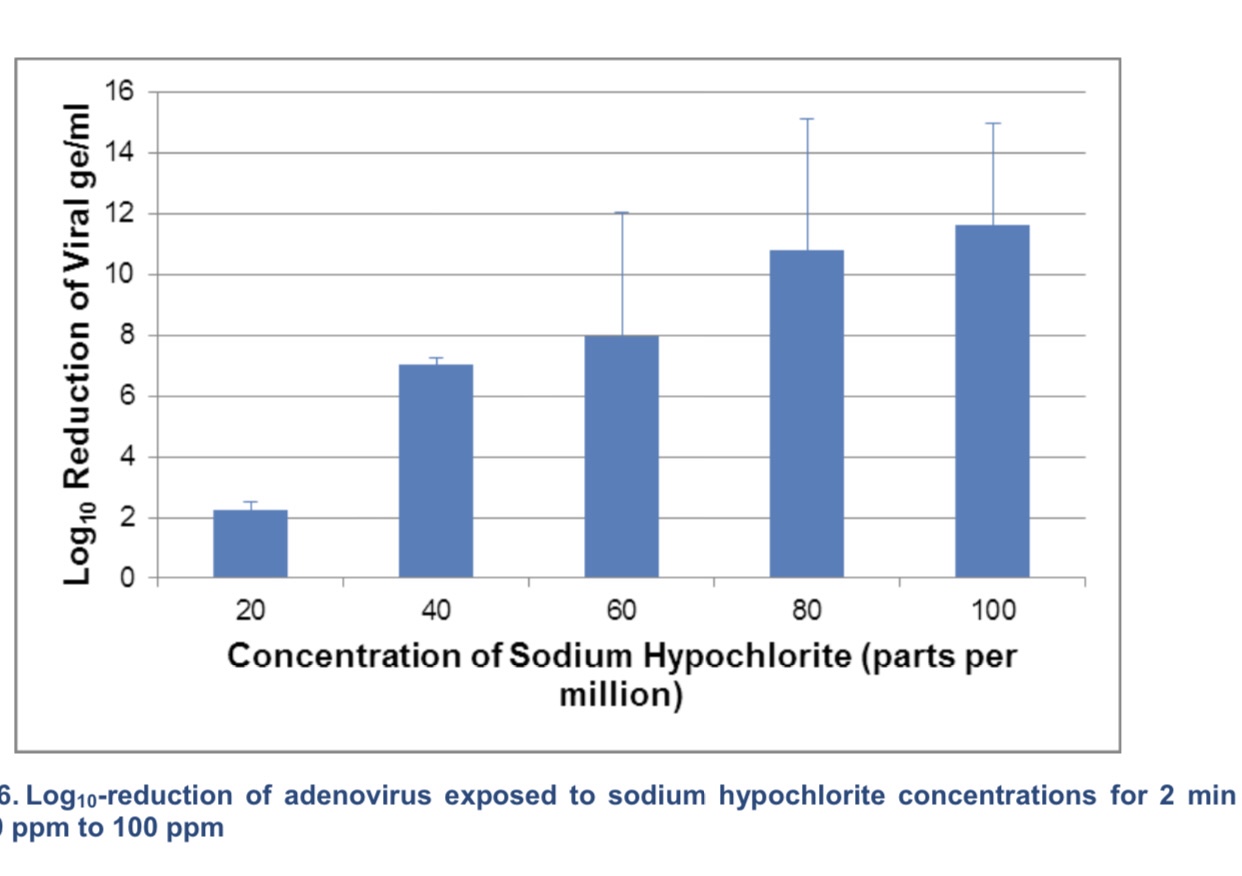
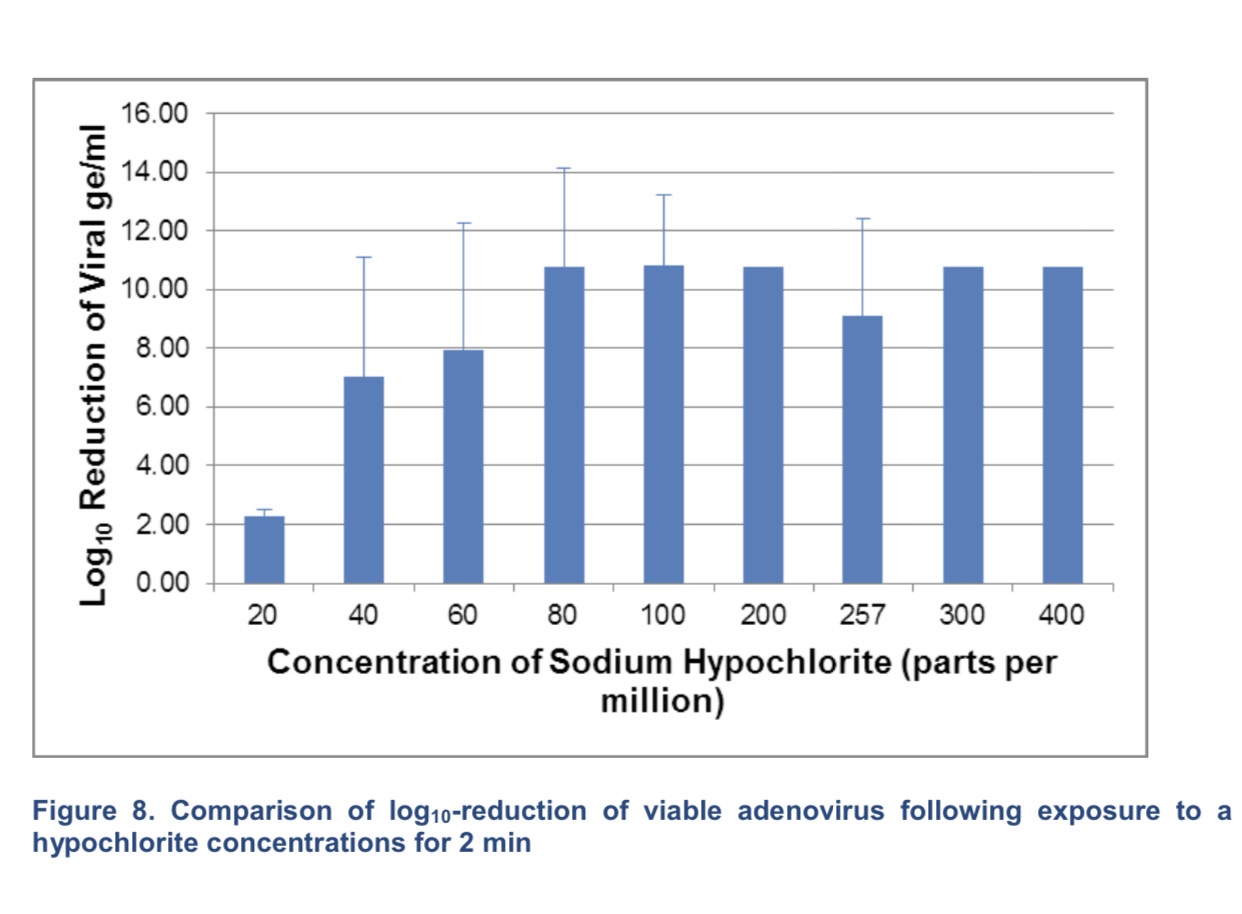
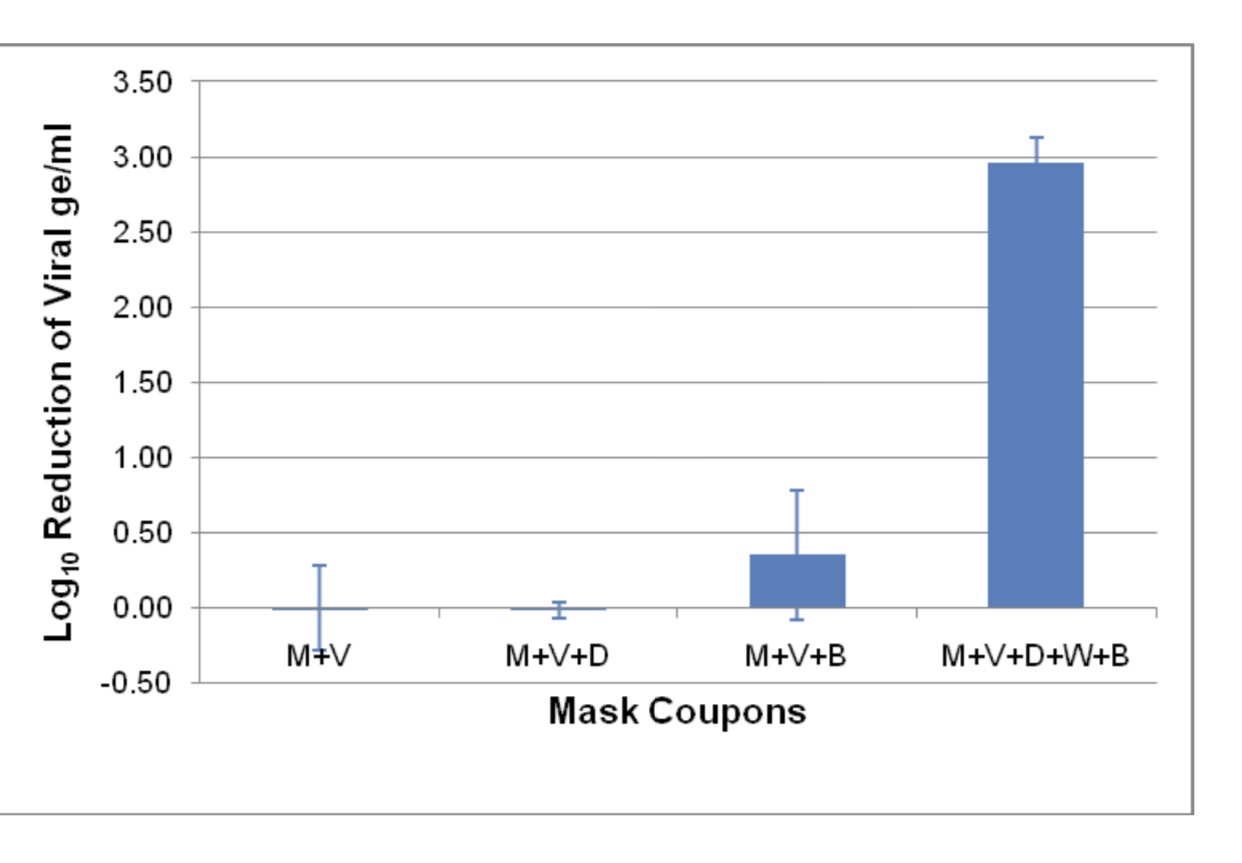
Adenoviral genome equivalents/mL following elution from mask pieces exposed to 181 ppm of bleach and/or detergent. M=mask, V=virus, D=detergent, B=bleach, W=water
How bad is prevalence of SARS-CoV-2, COVID, in highly vulnerable populations? The kidney hemodialysis population has a higher proportion of older people, men, and people living in majority Black and Hispanic neighbourhoods than in the US adult population. Seroprevalence of SARS-CoV-2 was 8.0% , 8.3% when standardized to the US dialysis population, and 9.3% (8.8–9.9) when standardized to the US adult population https://www.thelancet.com/action/showPdf?pii=S0140-6736%2820%2932009-2. Even for the most vulnerable, the highest prevalence argues against natural herd immunity and more for the typical “animal” coronavirus endemic sustainment strategies that these viruses have evolved with their hosts. For the least at risk populations, the samples examined in a recent study, showed 250 were positive of 33,041 children (age of 0-18 years) without symptoms who were tested at 28 hospitals for SARS-CoV-2 through May 29, 2020. Across the hospitals represented by these children, prevalence varied from 0% to 2.2%, with a pooled prevalence of 0.65% (0.47%-0.83%). Asymptomatic pediatric prevalence was associated with weekly incidence of COVID-19 in the general population during the 6-week period over which testing of asymptomatic children occurred. No other factor (population, number of tests performed, region, testing indication, or sample collection site) demonstrated a significant association with prevalence in asymptomatic infected children. Later data from 15,612 children were compared with prevalence in an asymptomatic pediatric population calculated from concurrent Johns Hopkins University weekly incidence data using a best-fit equation derived from this correlation, and the results showed the correlation persisted at this later time (coefficient, 0.86). Therefore, the incidence in the local general population and contacts should drive testing in children.https://jamanetwork.com/journals/jamapediatrics/fullarticle/2769878.
The general US population incidence has been determined by various methods. As of April 4, 2020, the estimated case count was 5 to 50 times higher than the official positive test counts across the different states. Nationally, the estimates of COVID-19 symptomatic cases as of April 4 were likely in the range of 2.2 to 4.9 million, with possibly as many as 8.1 million cases, up to 26 times greater than the cumulative confirmed cases of about 311,000. When these methods were extended to May 16, 2020, it was estimated that cumulative symptomatic incidence ranged from 6.0 to 10.3 million, as opposed to 1.5 million positive test counts https://www.ncbi.nlm.nih.gov/pmc/articles/PMC7310656/pdf/nihpp-2020.04.18.20070821.pdf. How tests are applied is critical to the value of the data to making true numbers and distribution of the virus and cases of COVID-19.
